
Addendum: Angel of Philadelphia
—
Disclaimer: This content is for informational and educational purposes only and should not be construed as personal financial advice or a recommendation. The information provided does not constitute financial, legal, or tax advice, and you should not act upon the information without seeking professional counsel from a qualified advisor. The website owner and contributors are not liable for any decisions made based on the information provided.
—
This may be my last post for a while, as I don’t really have a lot more to share unless something new happens in the market. This is going to be a long one though, so hopefully it’s enough to tide you over.
In chapter 3, I said there were additional relationships with Federal Reserve events that I didn’t detail at the time. What I’m about to share is harder to follow than chapter 3, so if I didn’t lose you through all of that, I might be about to lose you now. I feel like Charlie in It’s Always Sunny in Philadelphia trying to explain his conspiracy on the postal service as I go through this.

Puzzle Piece #1: Jackson Hole
As I detailed in chapter 3, the opening prices of Federal Reserve events appear to be the most important price levels from a technical analysis perspective on SPY. I was focused on FOMC interest rate decision dates in that chapter, but the most important event in the universe of central banking is the Jackson Hole Economic Symposium. Every year in August, central bankers, finance ministers, academics, and influential market participants meet in Jackson Hole, Wyoming to discuss economic challenges and associated policy responses. The Chair of the Federal Reserve also gives a keynote address on the last day of the symposium, making this speech date the most important date, in my opinion, in trading.
https://en.wikipedia.org/wiki/Jackson_Hole_Economic_Symposium
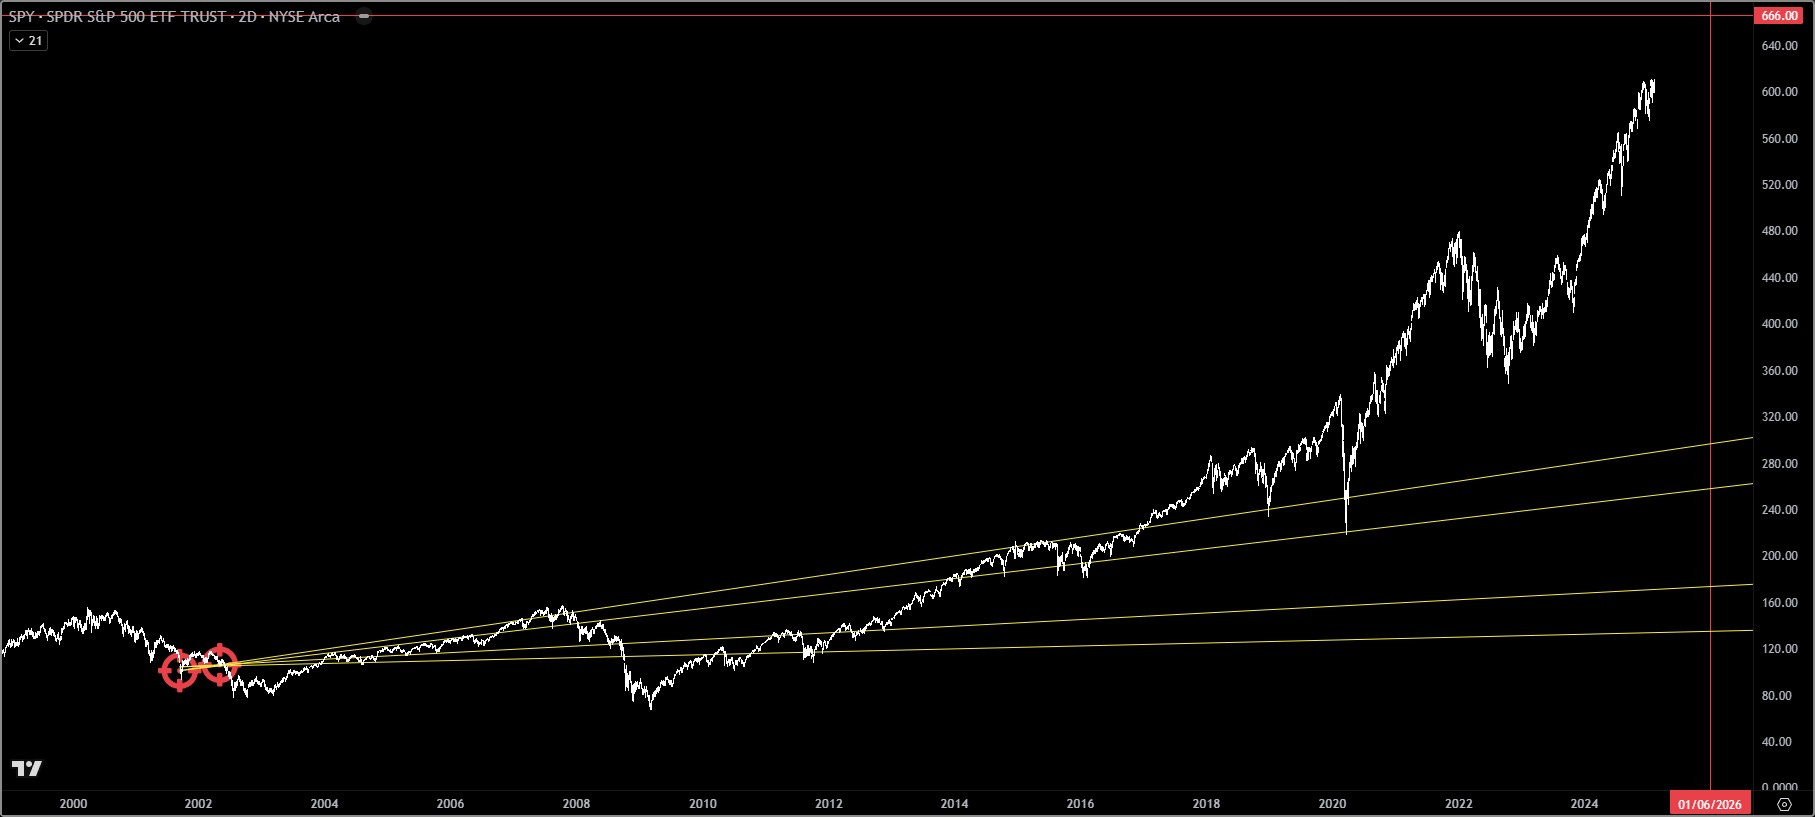
To keep a common reference point with chapter 3, I’ve left the 666 Fibonacci retracement and the vector that points to 666 on 01/06/2026 on all screenshots in this section of the addendum. The new white horizontal levels are the opening prices of Jackson Hole speech dates going back to 2012. They all extend right from their originating dates. Logarithmic scale is used for all of the charts in the first section.
I’m sorry if these charts get busy.
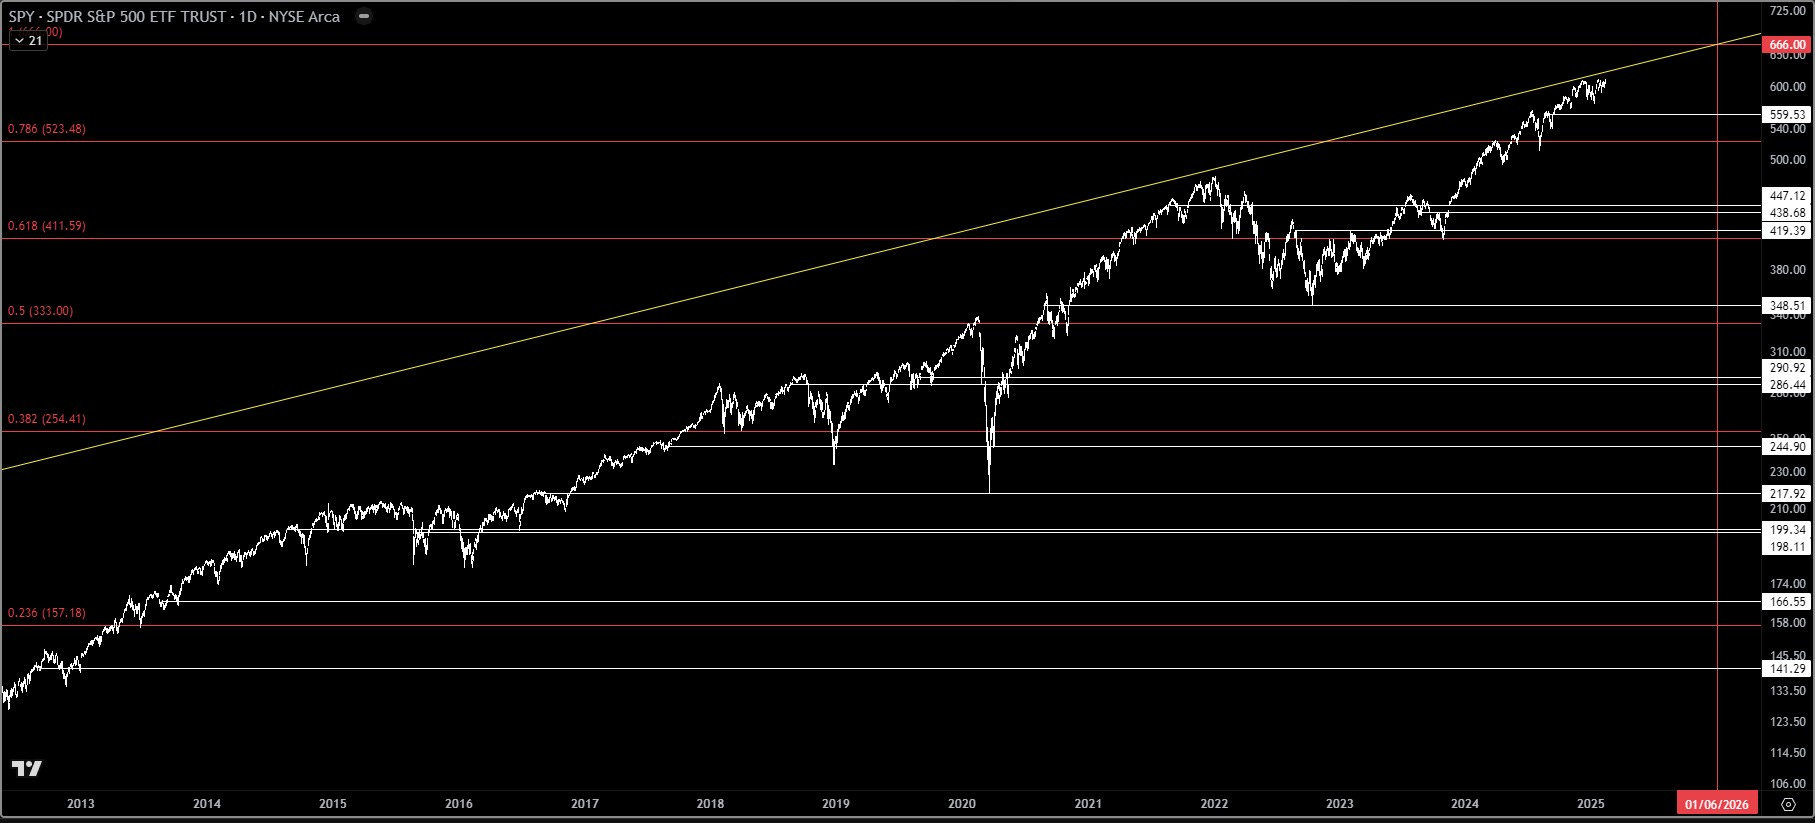
In the chart above, you might be able to identify without annotations that along with the 666 Fib ratio levels, these Jackson Hole opening price levels also act as either major points of control (aka POCs or pivots) or bottoms during market corrections, and some of the bottoms are to within a few cents.
Points of Control:
The opening prices of Jackson Hole in 2018 (08/24/2018) and 2019 (08/23/2019), 286.44 and 290.92 respectively, acted as POCs until the second half of 2020.
The opening prices of Jackson Hole in 2014 (08/22/2014) and 2015 (08/31/2015), 199.34 and 198.11 respectively, acted as POCs until the second half of 2016.
Bottoms:
The Jackson Hole 2020 (08/27/2020) opening price (348.51) acted as the bottom to within a few cents (348.11) during the 2022 through 2023 market correction.
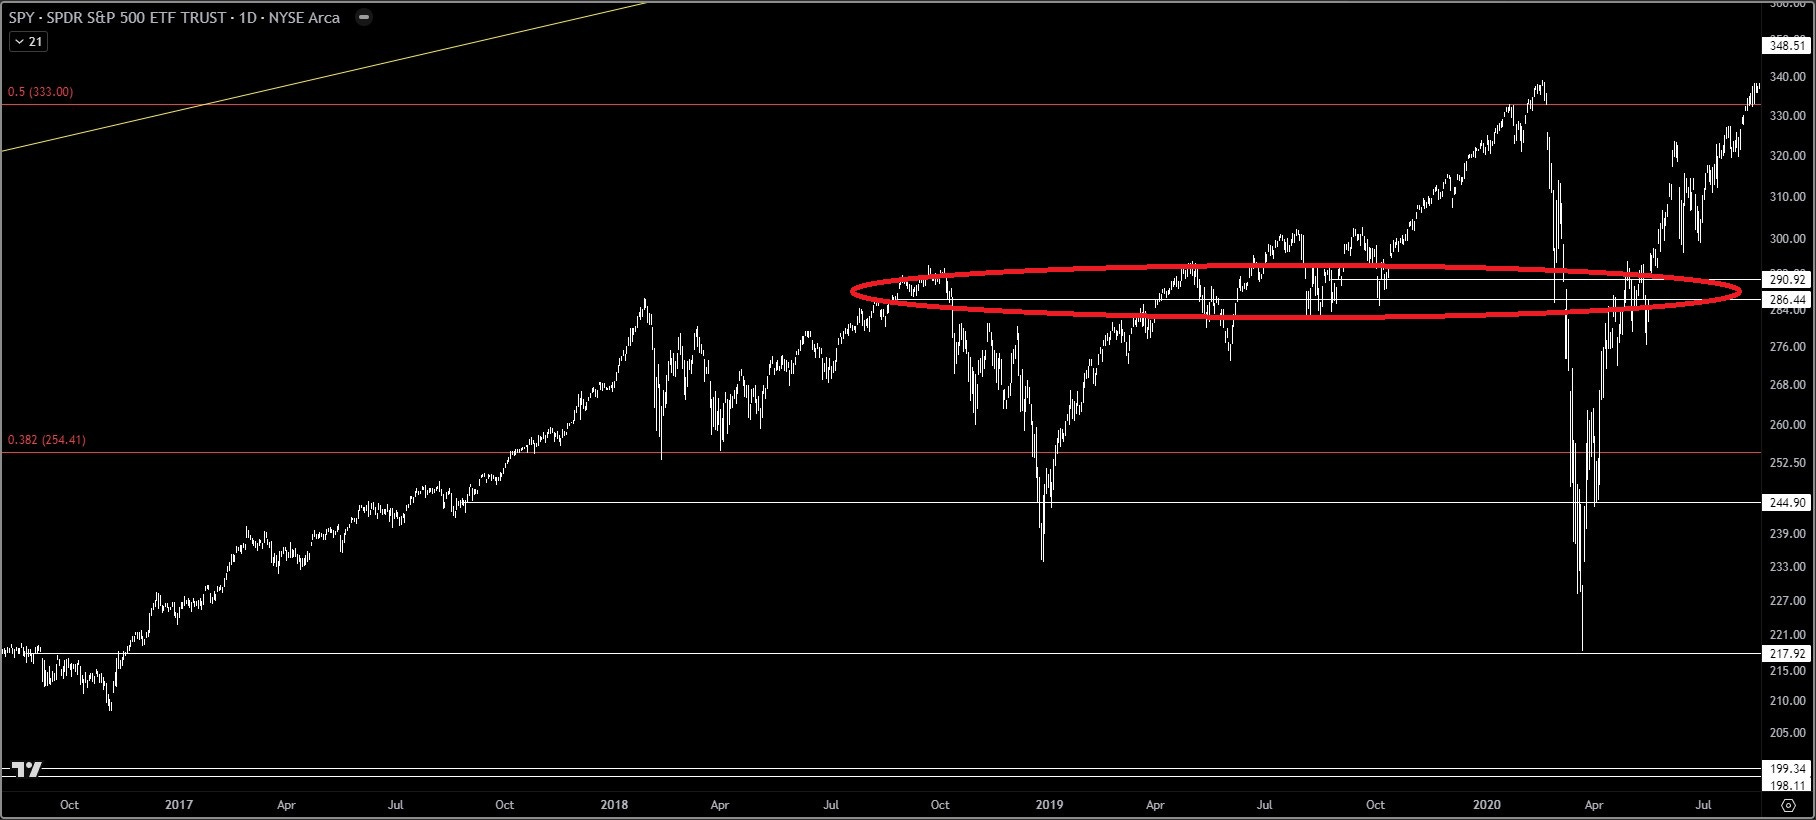
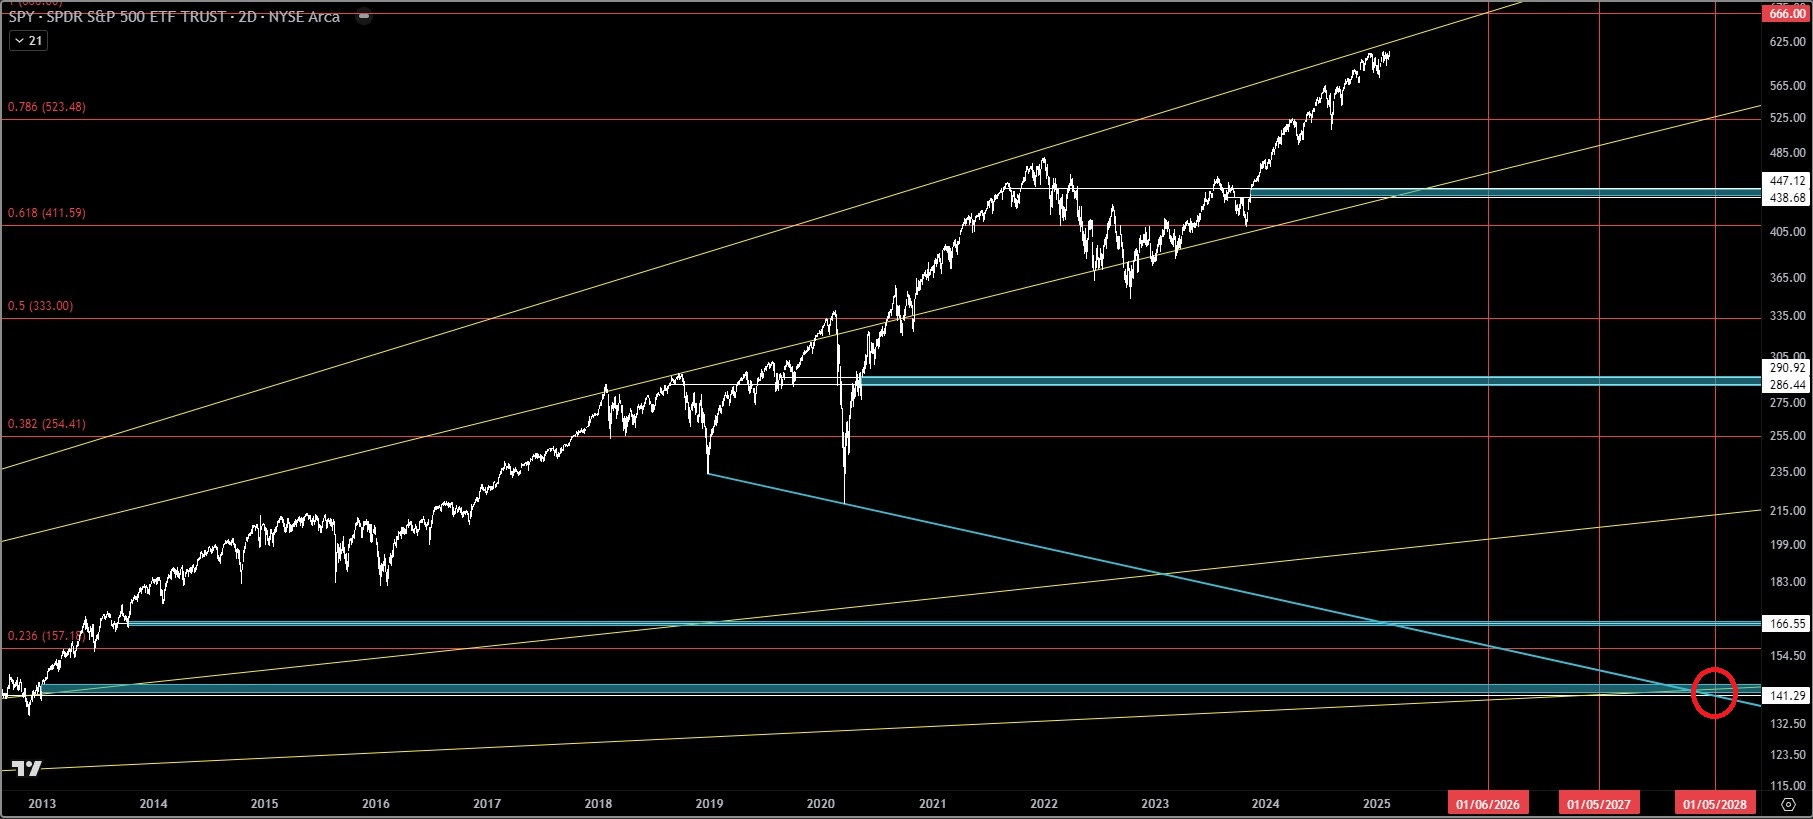
The chart below is the same as the first from the “Points of Control” section above, just with different annotations.
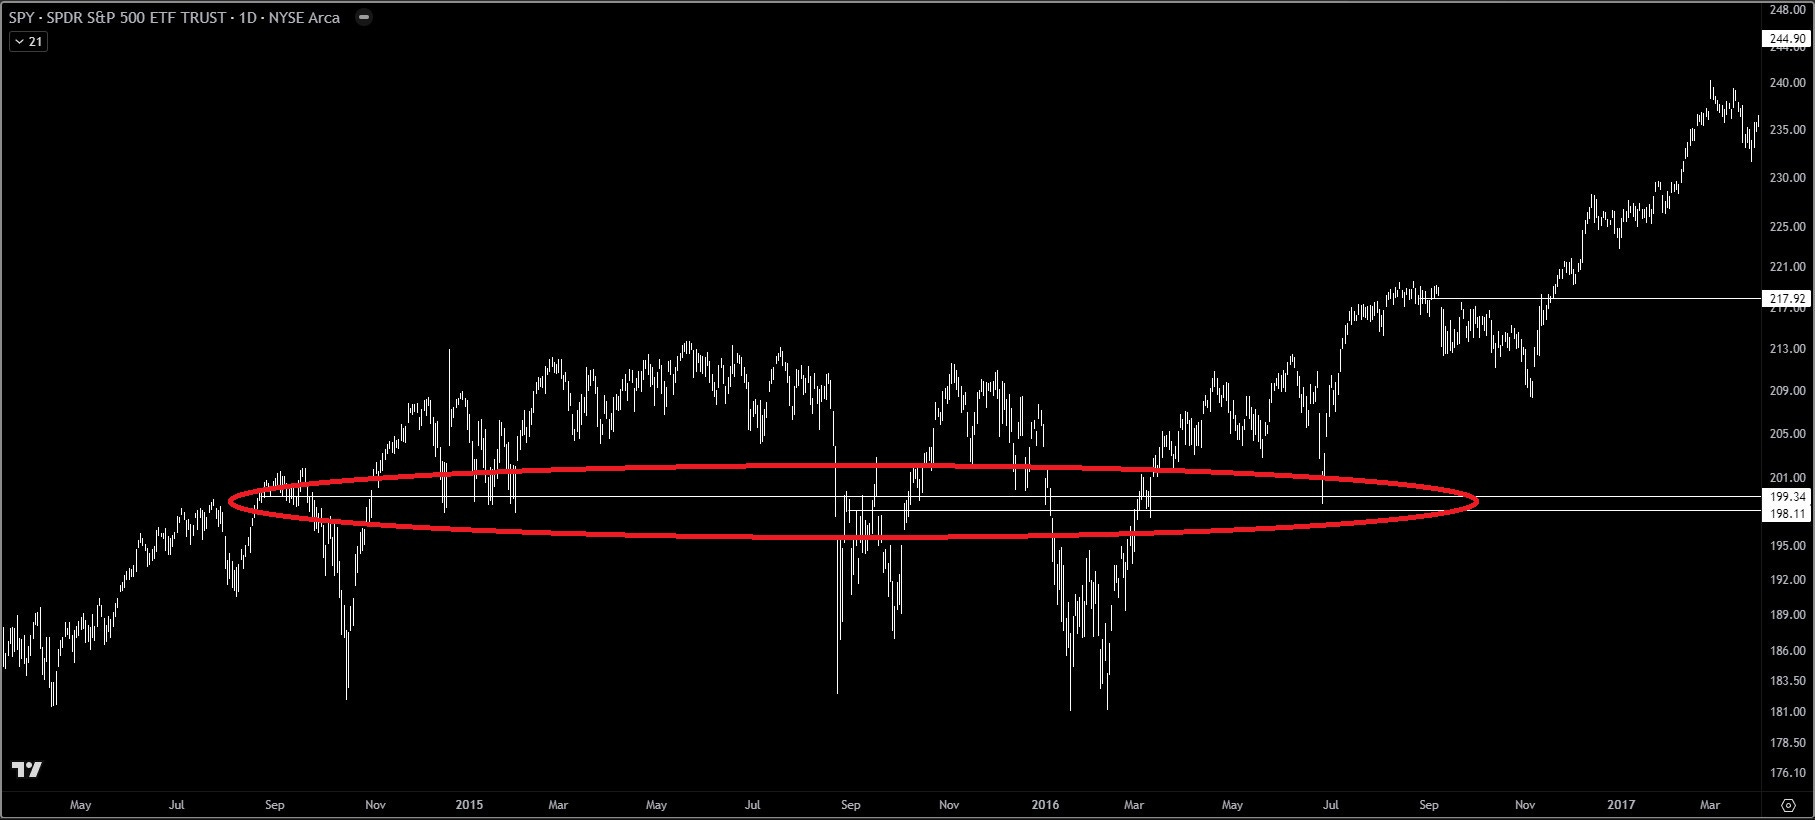
The Jackson Hole 2017 (08/25/2017) opening price (244.90) acted as the bottom to within a few dollars (233.76) during the taper tantrum in 2018. Price did briefly dip below the level, but with an immediate recovery. Also in the same chart, the Jackson Hole 2016 (08/26/2016) opening price (217.92) acted as the bottom to within a few cents (218.26) during the COVID-19 crash in 2020. These two bottoms will be revisited later.
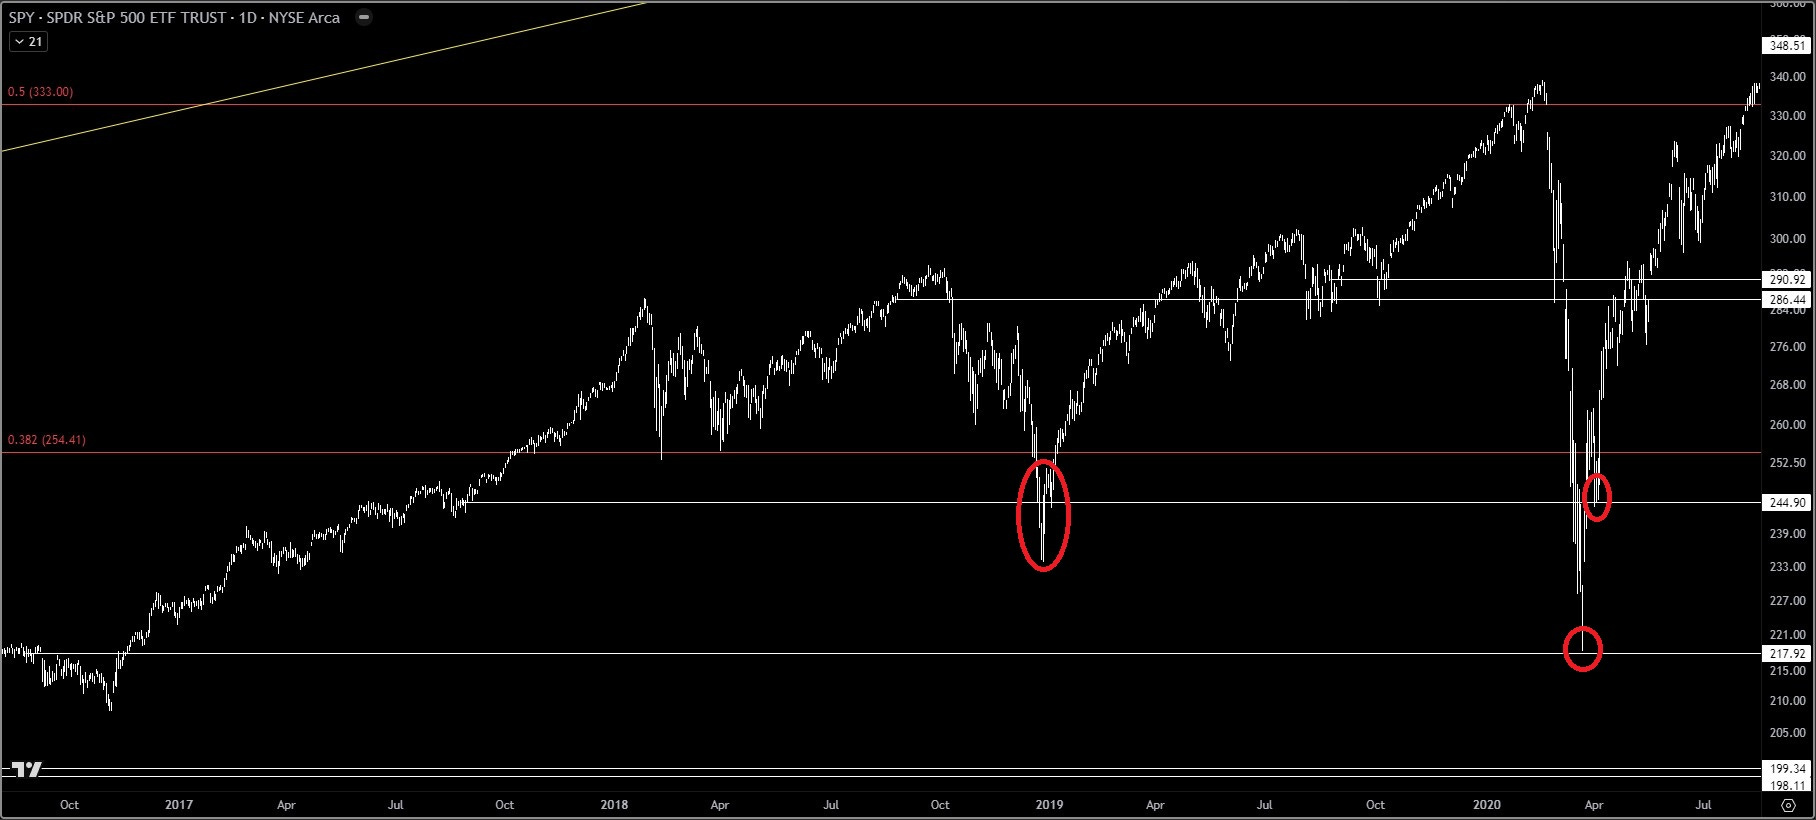
It makes me wonder, are these levels what some in the market refer to as the “Fed Put?” The term Fed Put refers to the belief that there is a price level in markets at which the Federal Reserve will step in to take accommodative actions to stop a crash. Or are they simply targets during orchestrated events?
There have been four more Jackson Hole events in 2021 through 2024 with significant price interactions as well, but I’m going to first focus on two events that go further back, since these haven’t acted as any sort of major pivot or bottom yet, and both have gaps at each level.
Jackson Hole 2012 (08/31/2012): 141.29
Jackson Hole 2013 (08/23/2013): 166.55
What is a gap? A gap refers to a disconnected space in the chart of a stock where the price opens higher or lower than the previous day’s closing price, with no trading activity in between. I’ve highlighted these as blue boxes in the chart below, with each gap extending right from where they originated.
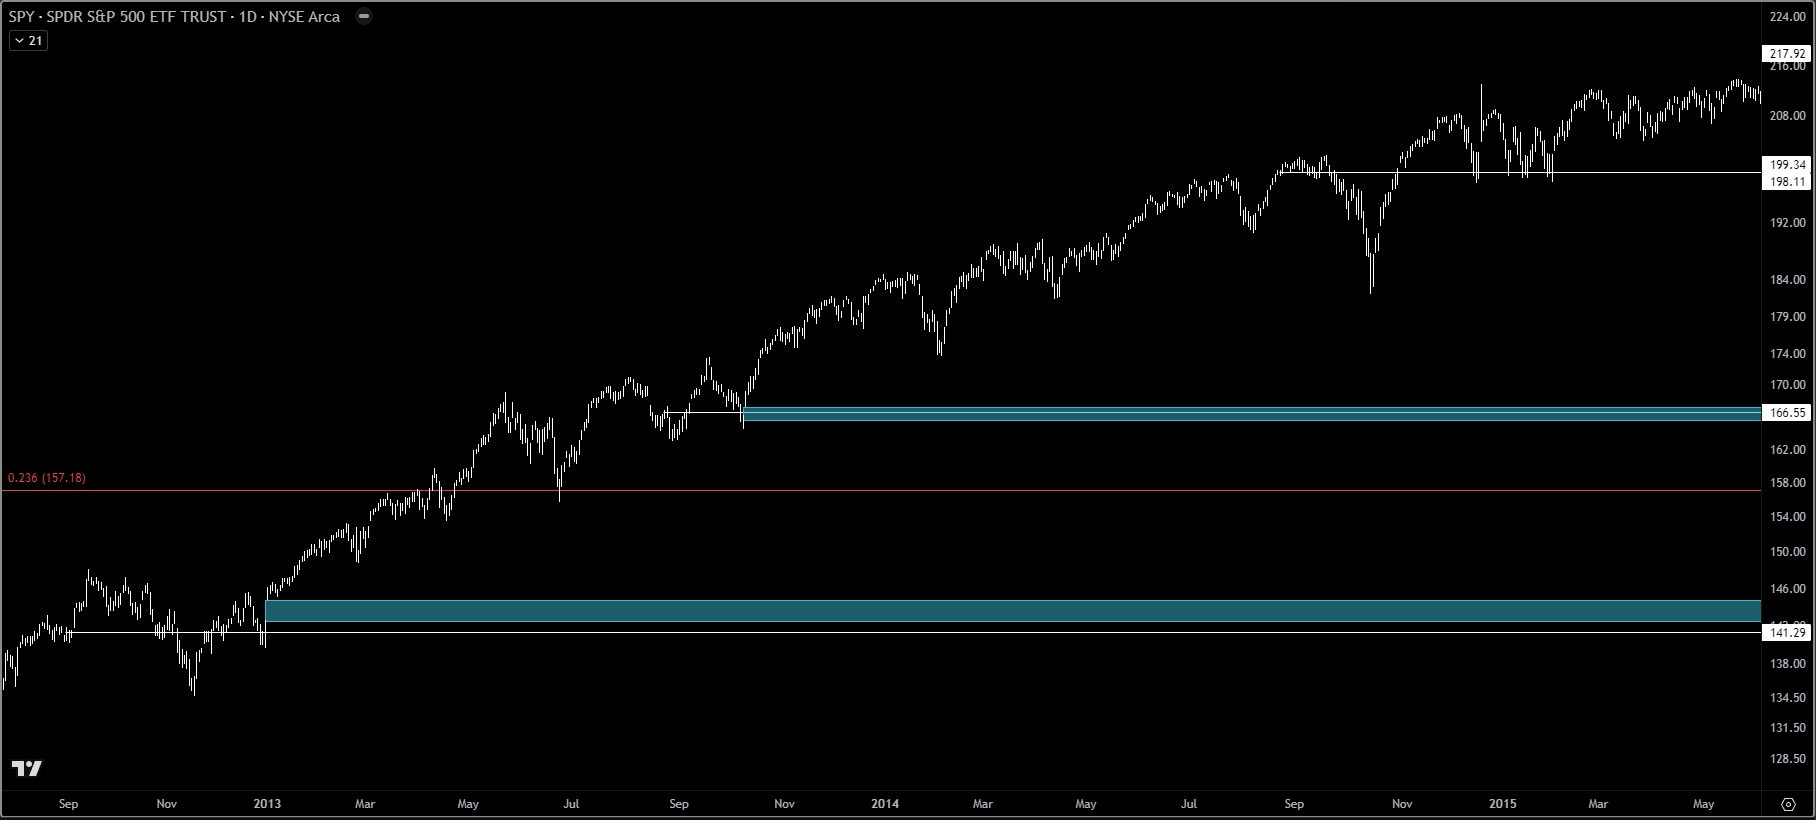
There’s a general rule of thumb in trading (it’s hard to call anything a hard rule) that significant levels must be retested and all gaps eventually get filled. These significant Jackson Hole levels and gaps exist so far back in the past that some might say they’re immaterial now, but I believe based on all of the other chart shenanigans that I’ve already identified related to the Federal Reserve, that these gaps at these significant levels were left on purpose, to be addressed at a later time.
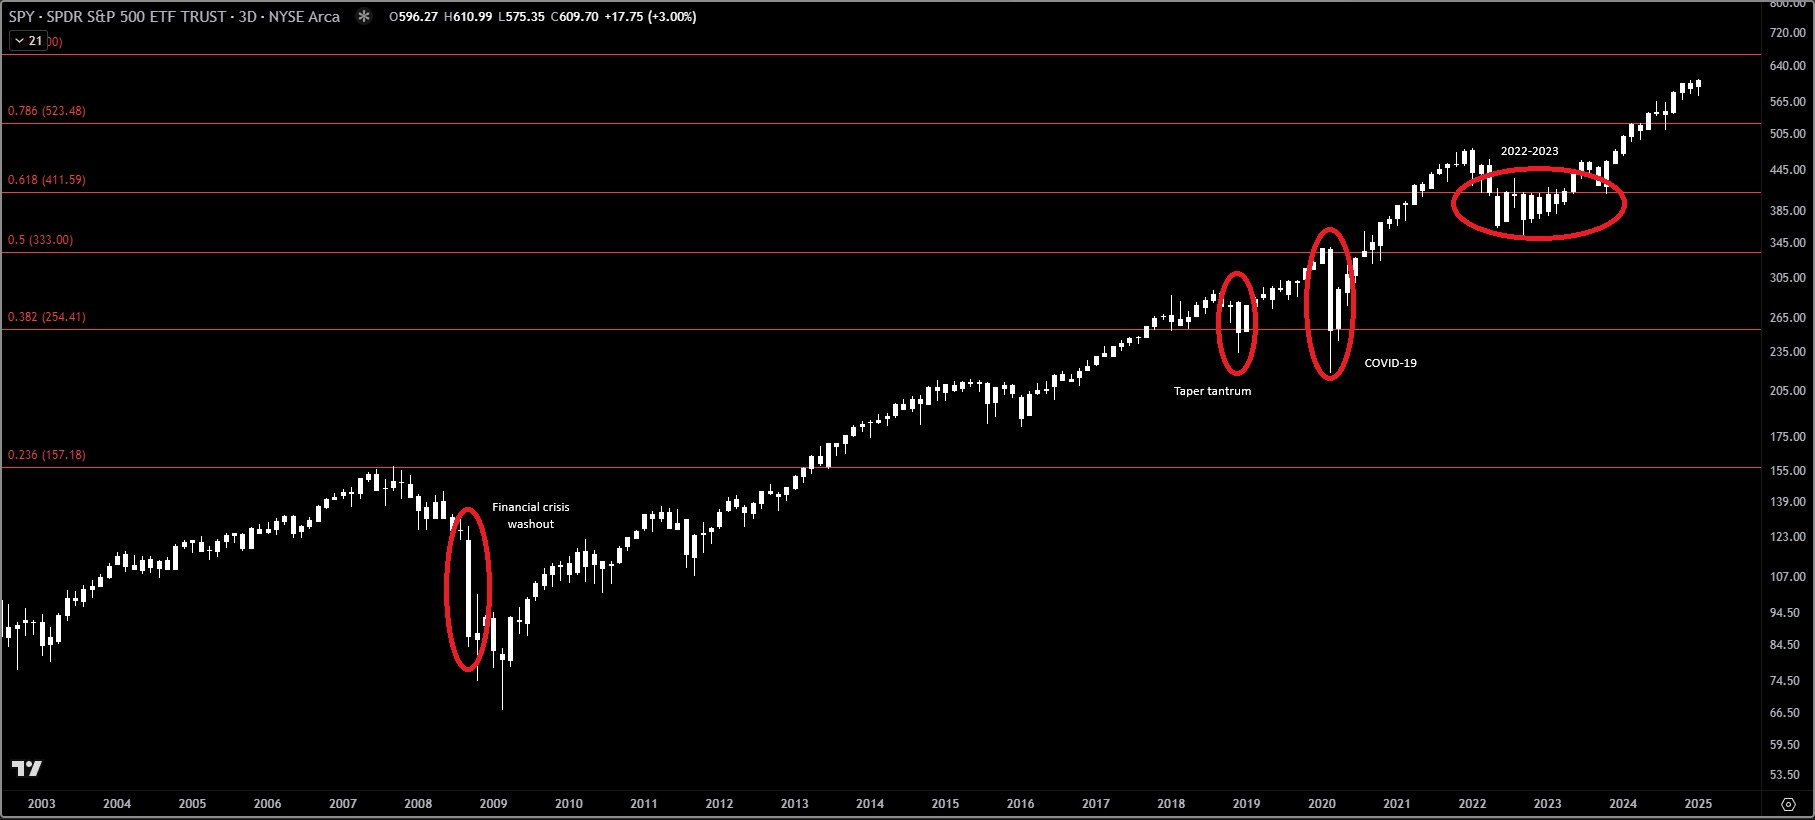
To show the gap rule to those who might not be into trading, I’ll provide one recent chart of SPY below to illustrate the point. In the following charts, blue boxes denote gaps following the definition above. The boxes extend right until the gap is eventually closed as price retraces to fill said gap before continuing upward.

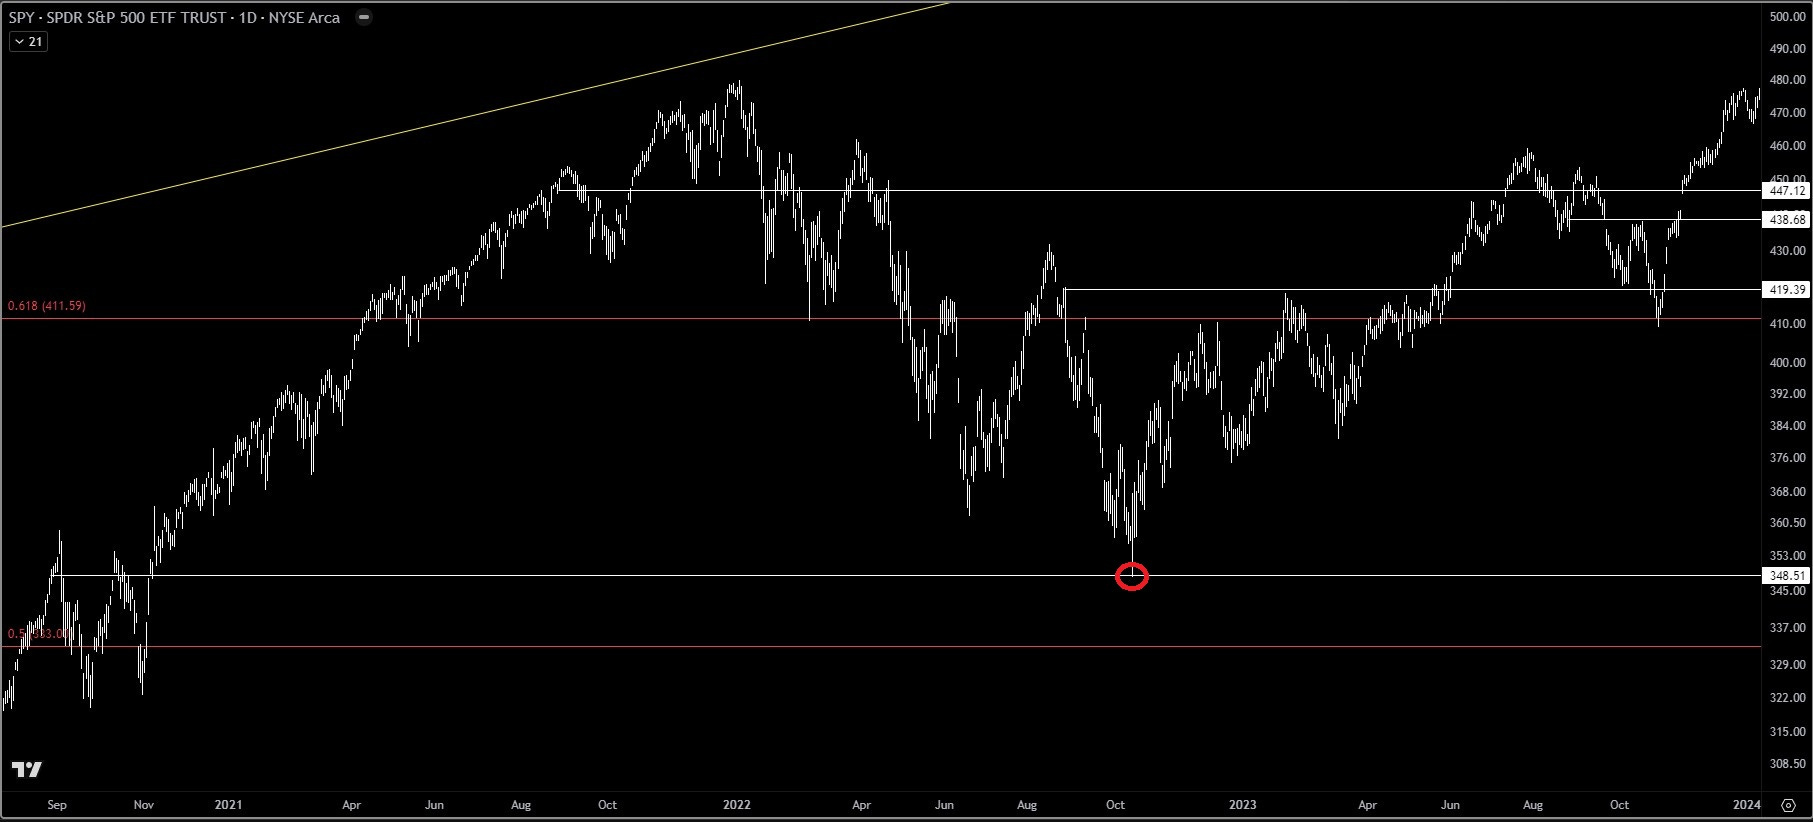
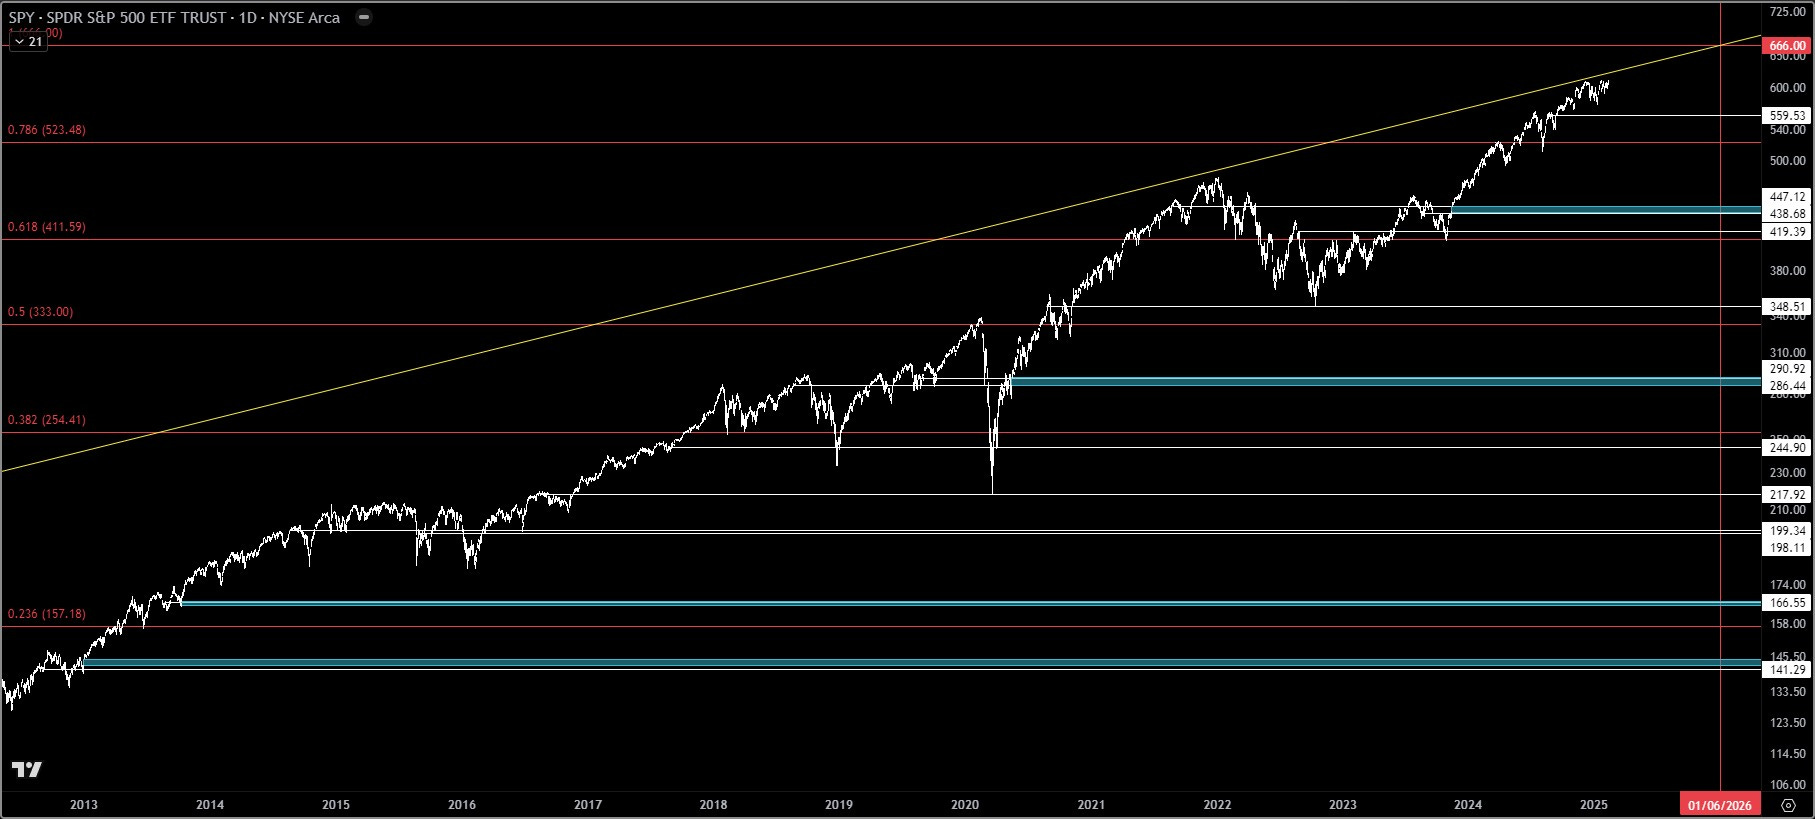
Notice the still unfilled gap at around 440 as well. You’ll find this gap on the chart below sitting right between the two Jackson Hole opening prices of 2021 (08/27/2021) and 2023 (08/25/2023), 447.12 and 438.68 respectively.

Lastly, during the recovery out of COVID-19, another gap was left at the opening prices of the 2018 and 2019 Jackson Hole events I already mentioned previously as having acted as POCs.

Put all of this together, and what does it look like? Four unfilled gaps sitting at six significant Jackson Hole levels.
If these gaps do ever get filled, can we make an educated guess as to when?
Puzzle Piece #2: The 9/11 Vectors
This section has a couple of charts that swap to linear scale. The first two still use logarithmic, but the last three use linear.
In chapter 3, I pointed out that connecting the opening prices of the first trading day after September 11, 2001 (09/17/2001; O = 101) and the May 2002 FOMC meeting (05/07/2002; O = 106.11) creates a vector that points to 666 on 01/06/2026.
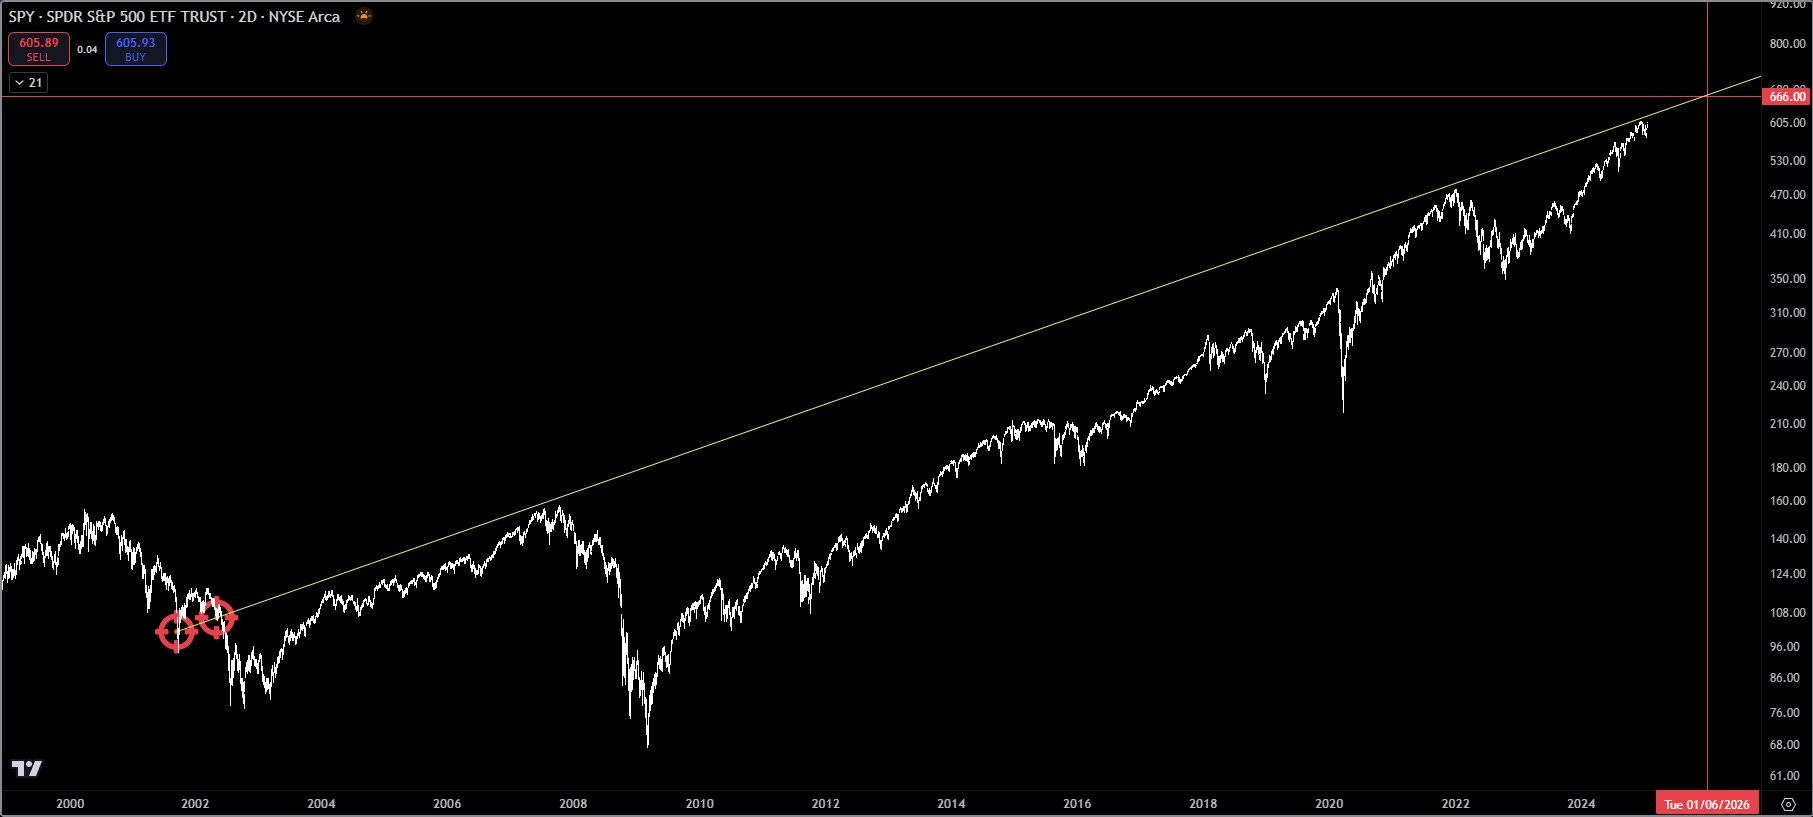
While opening prices do appear to be the most important data point for the Federal Reserve due to their ease of hiding (who uses opening prices in technical analysis?), using the closing price data in conjunction with the open also helps generate insight.
By connecting the opening (O) and closing (C) prices to create all vector permutations (OO, OC, CO, CC) of the same dates above, you get four vectors that create a fan structure.

The following charts in this section use linear scale showing the same vectors.
Zooming in shows how two of the vectors (OO & OC) were used as bottoms during the taper tantrum in 2018 and COVID-19 in 2020, these times more exact than the 666 Fib and Jackson Hole examples I’ve shown previously.

I’ve brought up the taper tantrum and COVID-19 bottoms three times now in relation to the 666 Fib ratio levels, Jackson Hole opening prices, and 9/11 vectors. In trading this is called confluence, or when multiple indicators or points of analysis validate a trading hypothesis. The chart below illustrates that alignment of analysis.

Do the other 9/11 vectors (CO & CC) ever come into play?
Putting the Puzzle Together: Confluence
I now have a trading hypothesis that the gaps left at the Jackson Hole events from [2012, 2013, 2018, 2019, 2021, 2023], the 9/11 vectors, and the 666 Fibonacci ratio levels are all pieces to the puzzle of this rigged game of trading. Where events in the world around us are orchestrated to not only put fear into us during periods of staged turmoil, but also to frighten us into making rash decisions with our savings during market downturns. I was a victim of this many times myself before finding what I’m sharing.
So what could come next? No one can predict the future, and I certainly do not claim to be able to do so. I’m only pointing out strange coincidences left on charts relating to the Federal Reserve, but it seems like the trading chess board is already set for events scripted still to come.
—
I’ve removed most of the Jackson Hole event levels from the chart below to try to declutter it a bit, and a 2 day interval is used to fit everything on screen (that’s why the date callouts don’t say 01/06 at the bottom of the chart). Logarithmic scale is again used.
Connecting the bottoms of the taper tantrum in 2018 and COVID-19 crash in 2020 (both of which have various points of confluence with my theory already) creates a vector (blue descending trend line) that points directly to the 2012 Jackson Hole speech opening price (141.29) on 01/06/2028. The fourth 9/11 vector (CC) also points to roughly the same price on the same date on both linear and logarithmic scales. All of this sits just below the 666 0.236 Fib ratio level (157.18). More confluence?
All giant speculation, but if 666 is reached as a top on 01/06/2026 and the bottom is reached on 01/06/2028, that will mark 6x6 (6th day of the first and third year). What happens on 01/06/2027 to fill in the x? I don’t have any good technical analysis yet pointing to that date of any significance, but again, whoever is orchestrating this appears to really like the symbolism of 666.
Make of this what you will, but I’d just like to note that we have a president with a history associated with January 6th already. 01/06/2026 will be the first and 01/06/2028 will be the third January 6th of his second term.
Addendum Nugget: The 6 Week Cycle
If you’re a fan of the No Agenda podcast, and I think most of my readers are, you’re probably already familiar with the theory of the 6 week cycle. To paraphrase, it postulates that orchestrated events go in cycles lasting 6 weeks. If that theory is true, I think it can be timed to market cycles as well.
The clearest examples of this are the financial crisis washout in 2008, the taper tantrum in 2018, COVID-19 in 2020, and most of 2022 through 2023. A 6 week interval is used in the chart below, where each bar represents a period of 6 weeks.
Note how the each of the events listed above were contained within a period of 6 weeks. Also note how the 666 0.618 Fib ratio level (411.59) was used as the near-open or close for 13 different 6 week cycles.
The market just closed its first 6 week cycle of 2025.
—
I’ve created this Substack simply to share what I’ve learned. I do not expect to earn any money from my publications and will publish everything publicly for free. I’m following the Value 4 Value model, so if you find value in the information I share, tips are appreciated but never expected.